Objective Tracking of Calibration Model Quality

In the petroleum industry, this approach is applied at scale. Facilities often monitor dozens or even hundreds of predictive models simultaneously, such as summer, winter, and all-season fuel grades. In this example, 27 models (a 9×3 grid) are tracked, though some refineries monitor more than 300. The system works with any optical instrument and with any chemometrics assessment software.

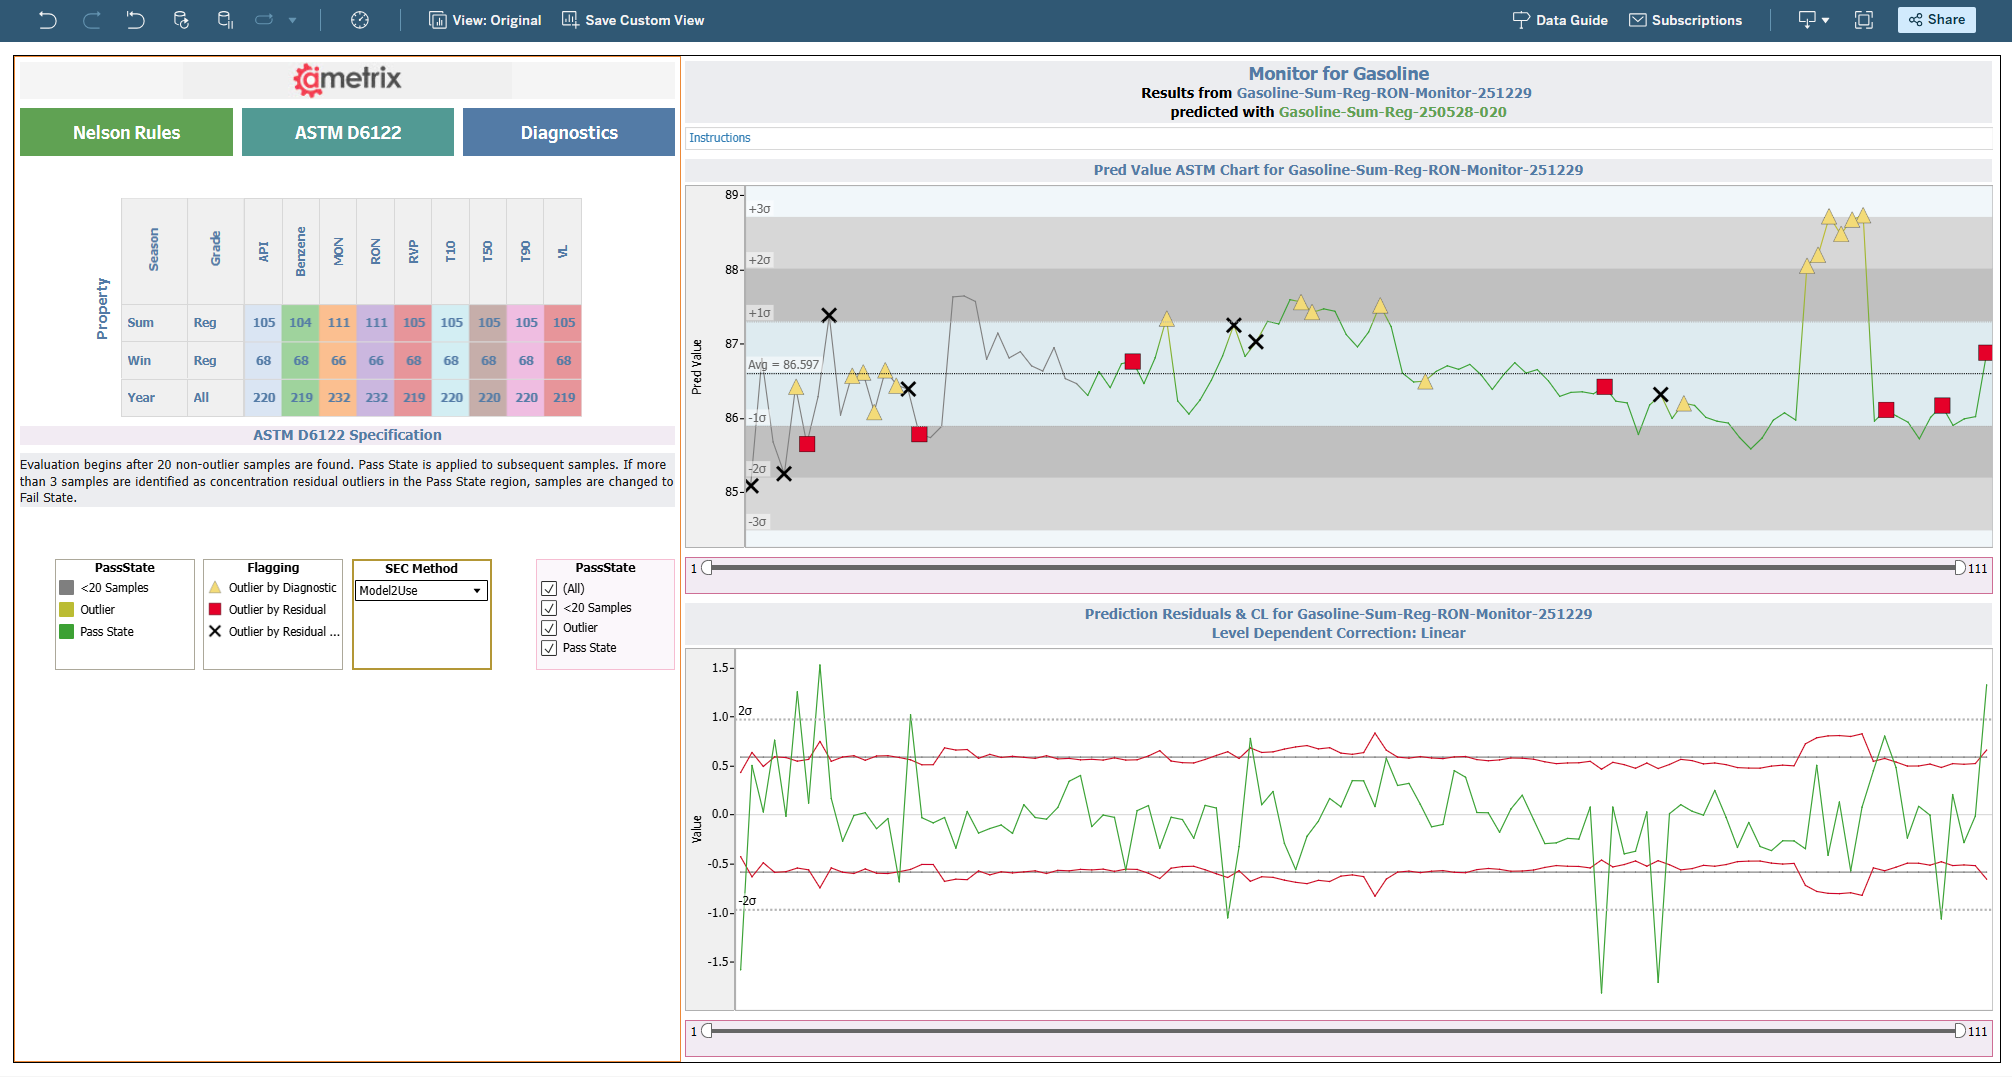
ASTM D6122 provides sample-specific guidelines for evaluating these models. Rather than relying on simple fixed limits, it defines dynamic, sample-specific thresholds. When samples fall outside these limits, Ai-Metrix can kick in to supply an updated model in minutes.

Different visual indicators convey different issues:

  • Yellow triangles represent samples that are statistically in control but unusual for the model. These are often good candidates for inclusion to improve model robustness.
  • Red squares indicate that model diagnostics are acceptable, but the predicted value does not match laboratory results—typically signaling a laboratory error.
  • X markers show both diagnostic failures and unusual samples, indicating a true system failure that requires intervention.

Although the ASTM calculations are complex, they are well-suited for automated computation. Once implemented, users can quickly drill into individual samples to examine diagnostics, model predictions, and laboratory values. This allows identification of discrepancies where the system is stable, but results are out of specification, often revealing process or lab issues rather than model faults.

By compressing large volumes of historical data into actionable metrics and applying these models in real time, organizations can distinguish false positives, detect procedural problems, and better understand the sources of disagreement between manufacturing and laboratory measurements.

ASTM’s work is notable because it formally codifies how to evaluate model performance—something that had not been standardized before. While adoption has been strongest in refining, these methods are largely unknown in pharmaceuticals, chemicals, and food manufacturing.

With real-time feedback and rapid model updates, these systems enable smarter, more adaptive manufacturing. This is where machine learning and AI naturally fit: not as replacements, but as practical overlays that enhance existing workflows and produce outputs that can support regulatory discussions.

Learn more about Ai-Metrix automation. Contact us at info@infometrix.com for a demo.

Unlock Data. Discover Systems. Save Big

IMAGE '25 MeetingVenue: George R. Brown Convention Center, Houston, TX

Date: August 24, 2025

Short Course:  SC-01: Chemometric Tools to Establish Petroleum Systems, Predict Physical Properties, and De-Convolute Mixed Production

Special Software Discount for SC-01 Attendees

Join Infometrix at IMAGE 2025 and discover how multivariate data analysis is transforming petroleum geoscience.

Dr. Kenneth Peters from LSB NExT Training and Brian Rohrback from Infometrix will be leading the short course Sunday, August 24th at the George R. Brown Convention Center.

This one-day course demonstrates how chemometric techniques, using real-world datasets, can enhance interpretation of geochemical, petrophysical, and production data – all powered by Infometrix Pirouette® software.

Exclusive Offer:
Register for SC-01 and receive a discount on Infometrix software license, optimized for the workflows presented in the course.

Expand your skillset. Enhance your toolkit. 
Learn from experienced instructors and leave with the power of advanced analytics at your fingertips.

Register today and claim your software discount.


Infometrix: Turning complex data into confident decisions.


IMAGE ’25 – International Meeting for Applied Geoscience & Energy

IMAGE '25 MeetingVenue: George R. Brown Convention Center, Houston, TX

Date: August 24-28, 2025

Short Course:  SC-01: Chemometric Tools to Establish Petroleum Systems, Predict Physical Properties, and De-Convolute Mixed Production

Course Leaders: Dr. Kenneth Peters from LSB NExT Training and Brian Rohrback from Infometrix will be leading the short course on August 24th.

This one-day course is for all geoscientists who want to extract hidden information from substantial amounts of chemical and physical data using multivariate statistical (chemometric) tools. The course emphasizes applications rather than the mathematics of various chemometric methods and will include a demo version of Pirouette 5.0 chemometric software. Case studies focus on the following topics of immediate interest to geoscientists:

• Hierarchical cluster analysis (HCA) and principal component analysis (PCA) of biomarker and stable isotope data for oil-oil and oil-source rock correlation to establish petroleum systems.
• Quantitative regression analysis of chromatographic peaks by alternate least squares (ALS) to de-convolute mixed oils derived from two or more sources. In exploration, ALS identifies mixed oils (e.g., pre-salt and post-salt oils in the Middle East and Southern Atlantic). In production, ALS allows allocation of mixtures originating from multiple reservoir zones.
• Prediction of physical properties by partial least squares (PLS) of data obtained by micro-analytical techniques. PLS allows investigators to predict API gravity, sulfur, and viscosity for reservoir zones where only small samples of cuttings from storage are available for analysis.

For questions or more information, contact info@infometrix.com.

Deconvoluting Mixed Petroleum and the Effect of Oil and Gas-Condensate Mixes on Identifying Petroleum Systems – AAPG ACE 2020

Virtual talk at AAPG ACE 2020

Watch recent virtual talk by Ken Peters at AAPG ACE on using Pirouette’s unmixing algorithm for evaluating oil production.


Two points made in the talk are:

  • You cannot use ratios as the input variables and need to use concentrations instead.
  • The alternating least squares algorithm performs well to untangle mixed sources accurately.

IFPAC 2020 – Autonomous Calibration and Optimizing Chromatographic Interpretation

IFPAC 2020 cardIFPAC 2020
Feb 23-26, 2020
Bethesda, MD

See abstracts below for papers being presented at the IFPAC 2020 conference. Join us or contact us for more information.


Autonomous Calibration
Brian Rohrback – Infometrix
Randy Pell – Infometrix
Scott Ramos – Infometrix

The use of chemometrics in processing spectroscopic data is far from new; the processing of NIR data in petroleum refineries dates to the early 1980s and in the food industry well before that. Although the computers have improved in performance leading to speed ups in the calibration process, the procedures being followed have not changed significantly since the 1980s. Intriguingly, we have made decisions on the corporate level that work against each other. We are installing more spectrometers and at the same time we are reducing staffing for spectrometer calibration and maintenance. A change in approach is mandated. In the spirit of automation, there are tools from both the chemometrics and the general statistics realms that can be applied to simplify the work involved in optimizing a calibration. Robust statistical techniques require some set-up of parameters, but once established for an application, they are often useable in every other instance of that application. The result is a one-pass means of selecting optimal samples for a calibration problem and, in turn, simplifies the assignment of model rank. This approach solves two problems:


Optimizing Chromatographic Interpretation
Brian Rohrback – Infometrix, Inc.

The heartbeat of the process environment is in the data we collect, but we are not always efficient in translating our data streams into actionable information. The richest source of process information comes from spectrometers and chromatographs and, for many applications, these prove to be the cheapest, most adaptable, and most reliable technologies available. In chromatography, there is a rich history and the chemometrics role is well defined but rarely placed into routine practice. This paper will provide a retrospective of routine processing solutions that have solved problems in pharmaceutical, clinical, food, environmental, chemical, and petroleum applications. It also discusses how to use tech borrowed from other fields to provide more consistent and objective GC results, automate translation of the raw traces into real-time information streams, and create databases that can be used across plant sites or even across industries.